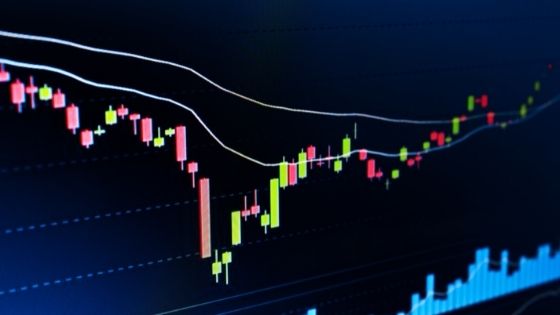
Did you know that reading a candlestick chart might help you estimate the market? Of course, the global financial market, including cryptocurrency, maybe quite volatile and unpredictable. But, it is feasible to comprehend how the market operates when analytical, qualitative research and asset management approaches are combined appropriately for assessment.
A candlestick chart is one of the most effective tools that technology has provided for traders to know what should be their next step. Reading candlestick charts in crypto trading gives traders a precise and realistic picture of all the price fluctuations over a specific period.
As a result, one of the trader’s most valuable talents is analyzing a candlestick chart. Candlestick patterns are generally utilized to indicate trade prices in the cryptocurrency market. So, understanding how to interpret candlestick charts is vital whether you are a long-term investor or a day trader.
What is a candlestick chart?
A candlestick chart is a succession of candles used by traders to determine all the price changes in any market. Candlesticks are a vital price movement tool that displays extensive prices, such as the open, close, high, and low, for a specific time frame. Candlestick charts in crypto trading are routinely used and assessed by traders to determine price fluctuations.
Because of the vast quantity of data included within candlestick charts, candlestick charts might appear a little daunting. But, they are pretty simple to comprehend once you can master it. For instance, the body of each candlestick is usually coloured green or red. Green indicates that the general price change was good throughout the period you have selected. On the other hand, the colour red indicates that the price change is negative.
Each candlestick symbolizes a certain period (or a trading period). The preferred option for candles is one day, but you may use a variety of alternative time intervals. Lower period intervals, such as one minute, five minute, or fifteen-minute charts, can be pretty helpful for day trading. And, more extended periods, such as one day, one week, or one-month charts, on the other hand, are more effective for long-term trading methods.
Important trading patterns to be aware of
While there are several methods to analyze and interpret candlestick charts in crypto trading, pattern identification is frequently used to forecast price movements, trends, and general momentum. They can be made up of one, two, or even more candlesticks, the most common of them are the bearish and bullish and bearish chart patterns.
The bullish candlestick pattern consists of six types:
- Hammer
- Inverted hammer
- Morning star
- Bullish engulfing
- Piercing line
- Three white soldiers
And, the bearish candlestick pattern also consists of six types:
- Shooting star
- Hanging man
- Evening star
- Bearish engulfing
- Dark cloud cover
- Three black crows
Thus, candlestick charts in crypto trading offer far more information than conventional line charts. Therefore, they are a more exciting and valuable technique for traders. However, they have several restrictions when used alone and are frequently employed with technical indicators such as RSI or Moving Average. Also. you can buy bitcoin cash at best price form reputed platform.


